Cradle Pattern Illustration
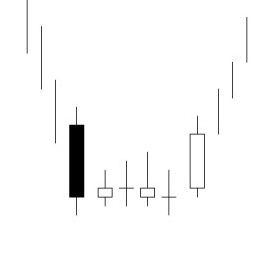
Cradle Pattern
The Cradle Pattern is a variation of the series of Doji at the bottom. It is aptly named, in that it looks like a ‘cradle’. This makes the Cradle Pattern an easily identified reversal pattern. It begins with the same visual alert found in most candlestick bottoming signals; a large Bearish candle at the bottom of a downtrend. This illustrates the extensive selling at the bottom. The following day shows a candlestick signal such as a Doji, Spinning Top, Harami, Hammer, or Inverted Hammer, indicating that the selling had stopped. Now the candlestick investor should be watching for a Confirmation ‘Buy’ Candlestick Signal. Keep in mind, the small indecisive trading signals may occur for a number of days before the ‘buy’ signal appears.
The Cradle Pattern reveals investor sentiment. If the large dark candle is considered the headboard, the Bullish candle becomes the foot board. The Cradle Pattern formation is now hanging at the bottom, implying that the trend should move up from this level.
The Cradle Pattern was first introduced by Stephen Bigalow in his second book titled
High Profit Candlestick Patterns; Turning Investor Sentiment into High Profits
This Cradle Pattern is also part of our Flash Card Set 2 – High Profit Candlestick Patterns
The clear graphics makes learning these high profit patterns an easy process. Each pattern is fully explained on the backside of the card. The description of how and why the pattern is forming makes understanding the potential of the pattern easy to comprehend. Having this valuable knowledge at your fingertips allows an investor to extract large profits from the markets.
HIGH PROFIT CANDLESTICK PATTERNS
Cradle Pattern
Dumpling Top
Fry Pan Bottom
Jay-Hook Pattern
Scoop Pattern
Trading Channels
Gap Down Hammer at the Bottom
Gap Up Inverted Hammer
Gap Down After a Doji at the Top
Gap Down Doji at the Bottom
Gap Down Bullish Engulfing
Gap Down Bearish Harami
Gap Down Shooting Star
Gap Down Hanging Man
Tweezers Bottom
Tweezers Top
Multiple Tails to the Downside
Series of Shadows at the Top
Series of Doji at the Top
Series of Doji at the Bottom
Doji End of Flat Trading Range Top
Doji End of Flat Trading Range Bottom
Combination Bullish Signals at the Bottom
Combination Sell Signals at the Top
Double Bullish Engulfing Pattern
Double Bearish Engulfing Pattern
Double Bottom
Double Top
Breakout Through Moving Averages
Moving Averages Act as Price Magnets
Moving Average as Support
Moving Average as Resistance
For the Candlestick Forum Original Flash Cards, with the Major Signals, please click here.
Speak Your Mind