There is a lot of information for the beginning commodity trader to learn. Traded commodities include agricultural products, energy products, precious and industrial metals, and the newly created environmental commodities. A good way to approach commodity trading is to decide which traded commodities you want to deal in. Then it is wise to do Commodity and Futures Training. A commodity trading course will familiarize you with the commodities markets, commodity trading charts, and the application of Candlestick chart analysis to modern traded commodities.
Trading commodities in agriculture includes both crops and livestock.
Crop commodities are also referred to as grains, food, and fiber. Commonly traded commodities are cocoa, coffee, corn, cotton, oats, rapeseed, rice, soybeans, soybean oil and meal, sugar, and wheat. As an example, corn is traded in 5,000 bushel lots and soybean oil in lots of 60,000 pounds. Livestock and meat commodities include feeder cattle and live cattle as well as frozen pork bellies and lean hogs. Lean hogs trade in 20 ton lots. Agricultural commodities are subject to fundamental analysis as well as technical analysis. Technical analysis charts for trading agricultural commodities go all the way back to rice trading in Japan in the days of the Samurai. Although the modern commodity investing includes much more than rice, the centuries old principles of Candlestick chart formations and Candle chart patterns apply as well to corn futures and pork bellies today as they have to rice trading for centuries.
Energy commodities include crude oil, gasoline, ethanol, heating oil, natural gas, and propane. Commodity and Futures Training will help you understand the principles of trading commodities online with energy commodities. It will show you how commodity trading info optimized with Candlestick signals can optimize your profits in trading. Training will also help you pick effective commodity trading software and understand its use.
Precious metals traded as commodities include gold, silver, platinum, and palladium. These are traded as bullion. Although each of these metals has industrial use, only silver has substantial use in industry. Commodity investing in precious metals has become widely popular in recent years as the economy has faltered. With very heavy trading it is typical that technical analysis with Candlesticks will outweigh fundamental factors in the price swings of precious metals. With trading as heavy as it currently is the trader will be wise to stick very close to Candlestick basics in trading commodities such as gold.
Industrial metals as traded commodities include aluminum, copper, nickel, lead, recycled steel, tin, and zinc. Commodity prices in industrial metals closely follow the economy. These metals trade in metric tons. Environmental commodities are a totally different breed. Carbon offsets, energy efficiency credits, known as white certificates and renewable energy certificates are new creations meant to help protect the environment. As an example of environmental commodities, carbon offsets trade in metric tons of carbon dioxide equivalent from a mixture of green house gases. One offset credit is intended to represent the reduction of one metric ton of carbon dioxide emission. Companies that successfully reduce their emissions gain these credits and can sell them to companies that have yet to reduce emissions. Although industrial metals and greenhouse gas emissions are very different they both can be traded effectively using Candlestick trading tactics. To learn more about traded commodities and about how to trade them seriously consider Commodity and Futures Training.
Market Direction
What are the candlestick signals revealing about this market trend? The market is in an overbought condition but the market is healthy. Although this may sound like a contradictory analysis, the information provided in the charts allows an investor to make a refined analysis. Statistically, the Japanese Rice traders have discovered that a trend that has moved with eight or more positive closes is due for a correction. The last time the S&P 500 had more than 10 positive closes in a row was back in 1995. It has only done this a handful of times in the markets history. Expect some profit-taking, because everybody is expecting some profit-taking. However, although the market is overbought, there has been good profit-taking on an intraday basis. This makes for a longer, more solid trend. There is not any significant exuberance occurring when it can be seen that profit-taking is occurring on a consistent basis.
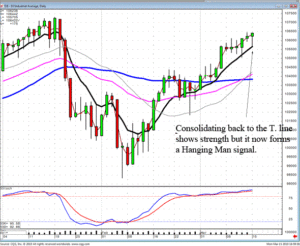
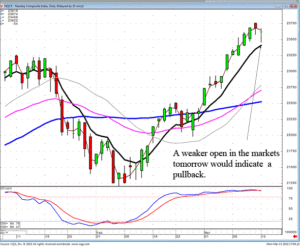
Today’s trading revealed Hanging Man signals in all of the indexes. This obviously makes for market conditions to potentially show a reversal. Witnessing negative premarket futures would warrant closing out long positions that were demonstrating some weakness.

DOW

NASDAQ
A major advantage for the candlestick investor is having the ability to identify both long and short potentials. The trading strategy becomes relatively simple during these market conditions. Long positions should be kept in place provided they are not showing confirmed sell signals. Confirmation requires a candlestick sell signal and a close below the T-line.
As long positions are closed out, the risk factor of rolling that money into additional long positions is relatively high. This is where the identification of strong short situations helps modify a portfolio exposure.
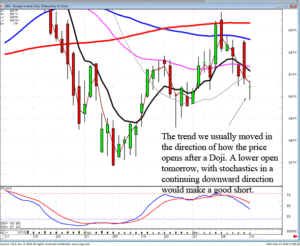
Simple scanning techniques reveal where strong selling is occurring. Adding a few short positions to the portfolio, even though a major cell signal has not occurred in the market indexes, acts as a good hedge. A good hedge is one that can produce profits even if market conditions don’t yet show the overall investor sentiment having change direction. As seen in our short recommendation on the BG chart, shorting the stock has high probabilities of produce a profit whether the market is going up or down. It provided an easy entry strategy today and still provides an easy entry strategy for tomorrow.

BG
Each of the major signals have very simple rules that make them effective. One of the rules for a Doji is that a trend will move in the direction of how they open the price after a Doji. Add that to the recent analysis of this chart, a dark cloud signal ending the uptrend at the 200 day moving average, followed by a bearish engulfing signal on Friday made for very simple trade. If it opened lower today, it could be shorted. Today’s Doji also makes for an easy trade. If it opens lower tomorrow, it can be shorted immediately. Stochastics indicate more downside following the candlestick sell signals.
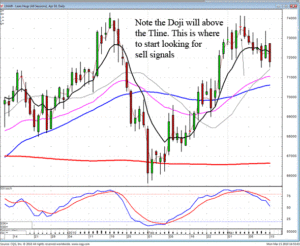
These same simple rules can be applied to very profitable commodity trading. Witnessing a sell signal as prices have moved a good distance away from the T-line make for a high probability short sale. As seen in our recent recommendation for shorting lean hogs, shorting after a Doji made the prospect of a test of the T-line very likely. A failure at the T-line would make the possibility of a downtrend continuing to the 50 day moving average or possibly lower. This is not rocket science analysis. This is merely utilizing the signals and confirming indicators that have produced consistent profits in the past.

Lean Hogs April
Chat session tonight at 8 PM ET.
Good Investing,
The Candlestick Forum Team
“Candlestick Signals Educational Package“
Website special reflects current newsletter. If you are reading an archived newsletter you will be directed to the Current Website Special.
Speak Your Mind