Equity market is another name for a stock market. The term equity also refers to the value of someone’s ownership of a business, property, or a shareholder’s partial ownership in a business. An equity is a stock or stock share not bearing fixed interest. In other words an equity’s value rises and falls with that of a company and its shares. It does not pay guaranteed interest as with a bond.
Use of the term equity market reminds us that a stock market investment is owning shares of a company’s assets. An equity market is a public market where stocks are listed, bought, and sold. An equity market, or stock market, has members who do the buying and selling. Everyone else pays a commission for this service in order to buy stock or sell stock. Now, in the computer age, exchanges such as the NASDAQ are virtual and all activity is in a computer system. This contrasts with the traditional “outcry” system of the New York Stock Exchange (NYSE) where orders flow through a real person, a floor broker.
Equity markets allow companies to raise money without borrowing. Rather than incurring debt the company sells ownership shares, giving away future profits and giving a vote in the affairs of the company for each share. Although a public stock company may not incur debt by issuing stock, it always runs the risk of a takeover. An outside party can purchase a sufficient number of stock shares to control the company’s board of directors, name its own management and take over the company.
Besides allowing a company to raise money, equity exchanges offer very liquid investments. Stocks are almost always easier to buy and sell and a clear market value than real estate, for example. There are equity exchanges throughout the world. The New York Stock Exchange and NASDAQ are the two large American exchanges. Canada has the Toronto Stock Exchange. European exchanges include the London Stock Exchange, the Paris Bourse, and the Deutsche Börse. Asia has the Hong Kong Stock Exchange, the Tokyo Stock Exchange, the Bombay Stock Exchange, and the Shanghai Stock Exchange. In Latin America there are the BM&FBovespa in Sao Paolo, Brazil and BMV, the Bolsa Mexicana de Valores. In the United States market indexes such as the S&P 500 help traders and investors follow the market sectors.
A problem with dealing in many equity markets outside of the United States is the lack of transparency. The United States Securities and Exchange Commission (SEC) oversees American stock markets, helping to insure that illegal insider trading, for example, does not enrich some at the expense of others. Although the SEC does not do a perfect job it provides an oversight that is sadly missing in many markets outside of the United States. Even basic stock information may be lacking on some foreign exchanges. Unless the investor has excellent inside information in some foreign exchanges, the best stock market investing strategy may well be to trade and invest at home.
Trading in the equity market requires learning the basics of stock market investing. As stock prices move up and down traders and investors buy stock and sell stock in search of a profit. A day trader will buy and sell within a day, typically holding no stock positions overnight. Long term investing engages in techniques like value stock investing in order to capture a stock at a low price and allow it to appreciate in value over many years.
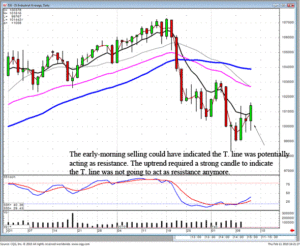
Did you know what the market needed to do this morning? Without candlestick signals, many people cannot answer that question. With candlestick signals, an investor can easily evaluate what is required to reverse or continue a trend. Yesterday’s trading produced a Doji in both the Dow and the NASDAQ. It was showing strength due to the fact that the previous day had been a very strong day. The early-morning selloff yesterday was the expected profit-taking. The Bulls needed to see a trading close near the top end of the trading range to indicate the uptrend was still in potentially progress. The other remaining factor was that neither the Dow nor the NASDAQ was able to close above the T. line. This created a potential warning.

Dow

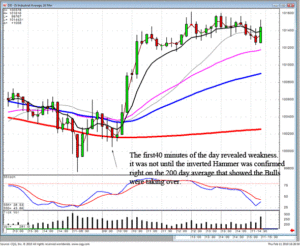
Dow 5 Minute Chart.
A candlestick signal, the Doji, allowed for a very easy assessment of what was required in today’s trading. If the Bulls were in control, the markets needed to open positive and trade positive. When that did not happen this morning, the next evaluation was to see whether the Bears were in control or whether this was another early-morning pullback. That becomes better evaluated by watching a five-minute and a 10 minute chart. After the initial 30 minutes of trading, it can usually be seen that the downside has found a churning area, a flat trading area where the Bulls and the Bears are in conflict. The analysis of a 10 minute chart visually fine-tunes an investors entry strategy. Once it could be seen the Bulls were coming back into the market, individual stock positions could be evaluated again to see if they were confirming their bullish signals.
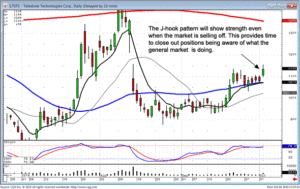
This is not a difficult analytical process. The chart patterns will be just the same on the daily chart as they will be for analyzing a five-minute chart. Having the ability to understand which signals and patterns work effectively at specific support and resistance levels allows for excellent stoploss procedures and excellent entry procedures. As illustrated in our recommendation today of TSTC, being able to assess that the Bulls were in control of this price even during the general market pull back, made for a very low risk trade execution.

TSTC
The simple logic of analyzing a stock price holding its own or trading slightly positive when the rest of the market is being sold off allows for a profitable generalization.. If the Bulls show evidence they are returning in the general market, it can be easily assumed that the initial strength of this stock’s price was going to show more strength in a strong market.
The nice thing about candlestick analysis is that it is the evaluation of something that consistently does the same thing over and over, human emotions. Taking advantage of the reoccurring price movements makes for a simple process for consistently pulling profits out of the markets. Please take time to peruse the benefits found in candlestick signals. The weekend of February 20 and 21st, the Candlestick Forum will be presenting a two-day comprehensive training on candlestick analysis. This is not a training that promotes you will be able to pay for the training with the first trade you enter after the training is over. This is a training that does promote the idea that when you understand the nuances built into candlestick signals and patterns, you control how the trades are performed and you eliminate the emotions out of your trading program. You will discover about correlating the daily chart with a five-minute and 10 minute chart greatly enhance your entry and exit strategies. Click here for more information.
Chat session tonight at 8 PM ET.
Good investing,
The Candlestick Forum Team
Speak Your Mind