The S&P 500 stands for Standard and Poor’s 500 Index and it is one of the most commonly used benchmarks of the U.S stock market. It consists of 500 companies that are extremely diverse in relation to their industries and these companies are chosen by the S&P Index Committee. The 500 companies that exist on this index are not simply the largest 500 companies but instead are actually chosen by the committee for a variety of reasons. These reasons include their market capitalization, revenue, liquidity, and sector representation in the stock market community. The team of analysts referred to as the S&P Index Committee also looks at factors such as the market value weighted index, meaning that the weight of each stock in the index is proportionate to its market value. Basically, the companies on this index are the leading companies in leading industries.
The S&P 500 is meant to be the leading indicator of the U.S. equities and to show the risk and return characteristics of the large cap universe (see large cap stocks). It represents about 70% of all the U.S publicly traded companies and part of what made it so renowned is the Vanguard 500 Index fund. This index fund is the largest of the mutual funds in the entire world. This index of 500 is also popular as a result of the first exchange traded fund (ETF), Spiders (AMEX: SPY), as well. These new exchanged traded funds are becoming more and more popular due to the lower expense ratios. There are also a small number of international companies that are included on the S&P 500 however the Standard and Poor Index Committee has stated that it will only continue to add United States based companies to the index in the future.
The Dow Jones Industrial Average (DIJA) used to be the most popular index for U.S. stocks. Most people however agree that the Standard & Poor’s 500 Index is a much better representation of the stock market in the United States. Additionally, the Dow Jones Industrial Average only contains 30 companies which is a smaller representation. There are also other Standard & Poor’s indexes such as the S&P 600. This index consists of small cap companies (see small cap stocks) with market capitalizations between 300 million dollars and 2 billion dollars. In addition to the S&P 500 is the S&P 400 which consists of mid cap companies with market capitalizations ranging from 2 billion dollars to 10 billion dollars.
Market Direction
What is one of the most powerful elements of candlestick signals? The visual depiction of what is occurring in investor sentiment right now. “Right now” can relate to a one minute chart as well as a daily chart. The added information provided by the open and close each day/time frame is extremely important. It is a trading techniques that has been refined for many centuries. This is a huge advantage over trying to learn investment techniques that have recently been discovered. A proven trading method passes the test of any market/trend conditions. It allows for accurate evaluation of a trend reversal as well as the analysis of when a trend will continue. Having the confidence that candlestick analysis works effectively allows for the continuation of its refinement. Candlestick analysis provides all of the above.
What is the T-line? This question is often asked in many of our chat training sessions. It is merely the 8 exponential moving average. A major advantage provided by the trading chat room on the website is the exchange of ideas for improving someone’s trading technique. The 8 exponential moving average has very consistent analytical features. Rick, who has utilized candlestick analysis for many years, has discovered other trading indicators that greatly enhance the probabilities of being in the correct trade at the correct time. He discovered the use of the T-line allowed for much more accurate transactions for entering or exiting a trade as well as continuing to hold during a trend. This is just one of the indicators that has allowed him to produce a very successful day trading career.
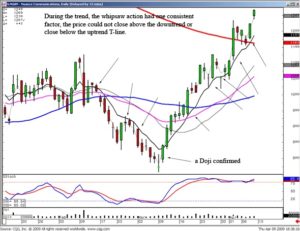
Candlestick analysis illustrates what is occurring in investor sentiment. Candlestick reversal signals represent a change of the previous investor sentiment. The longer a trend continues in a specific direction, the more compelling the reversal signal needs to be to show there has been a change of investor sentiment. The T-line acts as a very powerful indicator to demonstrate the continuation of investor sentiment or the confirmation of a change in investor sentiment. A trend has inherent forces that make it move in a specific direction. Until these forces are completely altered, the trend will remain consistent in a specific direction. As illustrated in the Dow chart, the recent downtrend evaluation was consistent with the trend remaining below the T-line. A Morning Star signal at the bottom indicated the confirmation of a reversal with prices closing above the tee line. This made the uptrend evaluation very simple. The uptrend would continue until a candlestick reversal signal and bearish confirmation below the T-line was experienced.
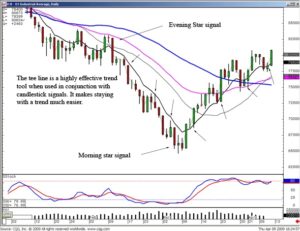
DOW
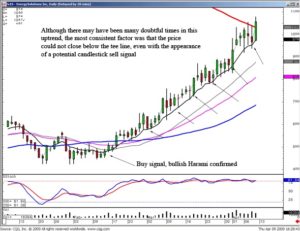
There will be ‘down’ days in an uptrend. There will be up days in a downtrend. However, unless a reversal signal is confirmed, the simple rules applied to the reversal signals and the tee line will keep investors in a position until a true change of investor sentiment has occurred. The major problem most investors experience involves their own emotions. When do I take profits? Not to take profits and give back hard-earned gains is one of the biggest fears for investors. Candlestick analysis eases the process. Applying simple rules with the signals and the trends dramatically reduces the anxiety most investors experience. Cut your losses short and let your profits run! Much easier said than done. Learning how to properly use candlestick signals and confirming indicators greatly reduces the possibilities of being left behind during a strong uptrend.
ES
NUAN
The candlestick rice traders took advantage of the information conveyed in candlestick analysis. Their processes greatly reduce the emotions involved with investing. If you use signals/patterns correctly, you wiii not be exposed to emotional forces that tug at most peoples investment decisions. This is true for the beginning investor as well as a seasoned trader. The more emotions can be taken out of investing, the more rational thought processes can help exploit consistent and large profits from the markets. Candlestick signals are proven. Learn how to use them correctly, your rate of return will grow dramatically.
As seen in the Dow chart, there has not yet been a candlestick signals with a significant close below the tee line. The uptrend still remains in progress until that simple combination appears. Remaining in positions, especially the financial stocks, using a simple rule produce huge profits on Thursday. BAC was up 35%, FITB was up 30%, FAS was up 40%. The financial stocks had been recommended on the candlestick forum for the past few weeks. Maintaining positions to eventually participate in big profit moves is made much easier when applying the tee line to the evaluation.
Public Chat Session tonight at 8 PM ET – it will be an abbreviated session so everybody can enjoy the long weekend.
Good investing,
The Candlestick Forum Team
Speak Your Mind